


The World Copper Factbook 2014
Refined Copper Production
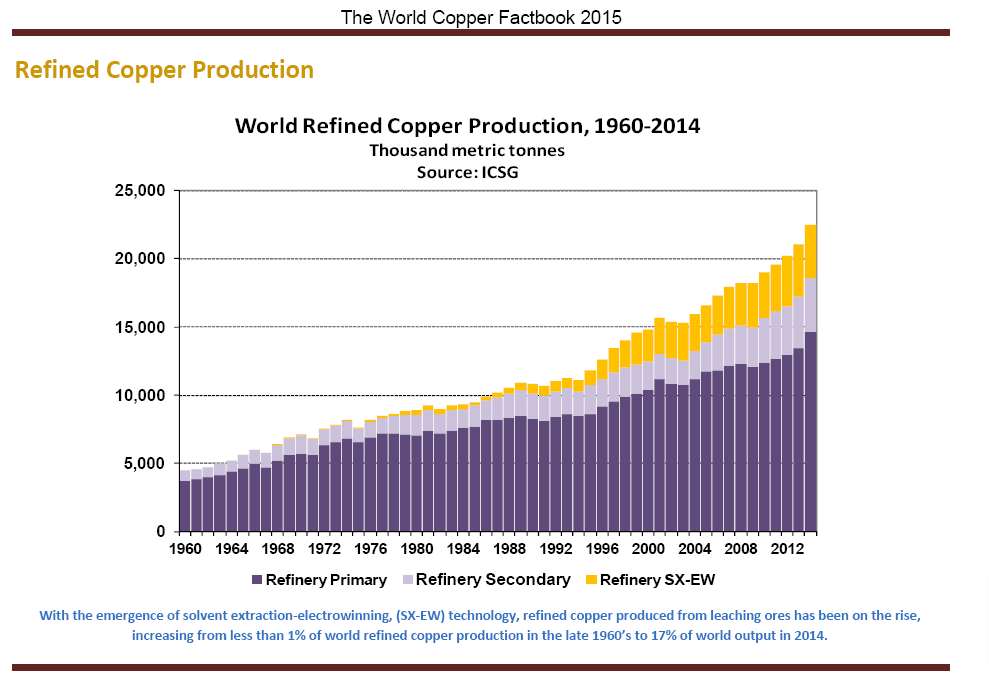
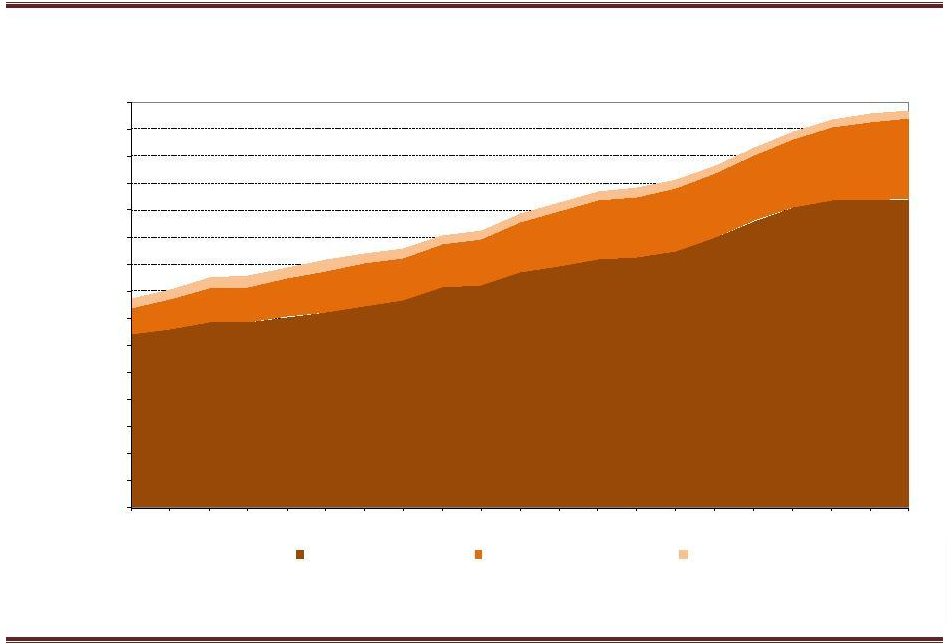
World Refined Copper Production, 1960-2013
Thousand metric tonnes
Source: ICSG
20,000
17,500
15,000
12,500
10,000
7,500
5,000
2,500
0
1960 1964 1968 1972 1976 1980 1984 1988 1992 1996 2000 2004 2008 2012
Refinery Primary Refinery Secondary Refinery SX-EW
With the emergence of solvent extraction-electrowinning, (SX-EW) technology, refined copper produced from leaching ores has been on the rise, increasing from less than 1% of world refined copper production in the late 1960’s to 18% of world output in 2013.
The World Copper Factbook 2014
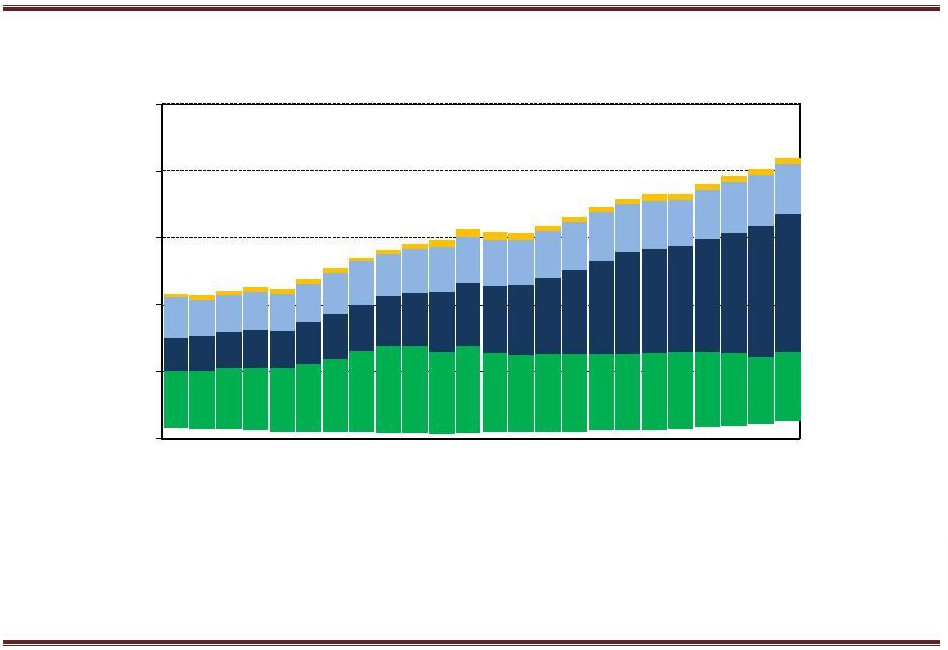
Trends in Refined Capacity, 1997-2017
Thousand metric tonnes copper
Source: ICSG Directory of Copper Mines and Plants - July 2014
30,000 | ||||||||||
28,000 | ||||||||||
26,000 | ||||||||||
24,000 | ||||||||||
22,000 | ||||||||||
20,000 | ||||||||||
18,000 | ||||||||||
16,000 | ||||||||||
14,000 | ||||||||||
12,000 | ||||||||||
10,000 | ||||||||||
8,000 | ||||||||||
6,000 | ||||||||||
4,000 | ||||||||||
2,000 | ||||||||||
- | ||||||||||
1997 | 1999 | 2001 | 2003 | 2005 | 2007 | 2009 | 2011 | 2013 | 2015 | 2017 |
Electrolytic | Electrowinning | Fire Refining | ||||||||
This chart shows world copper refinery capacity by refining process. The ratio between production and capacity is called the capacity utilization rate. The world refinery capacity utilization rate was around 79% in 2013.
The World Copper Factbook 2014
Refined CopperProduction byRegion, 1990-2013
Thousand metric tonnes
Source: ICSG
25,000
20,000
15,000
10,000
5,000
0 1990 1992 1994 1996 1998 2000 2002 2004 2006 2008 2010 2012
Africa | America | Asia | Europe | Oceania | |||||
Region with the highest output of refined copper in 1990: the Americas (4,250 kt), followed by Europe (3,000 kt)
Leading region in the world in 2013: Asia (10,340 kt) as compared to 2,500kt in 1990.
The World Copper Factbook 2014
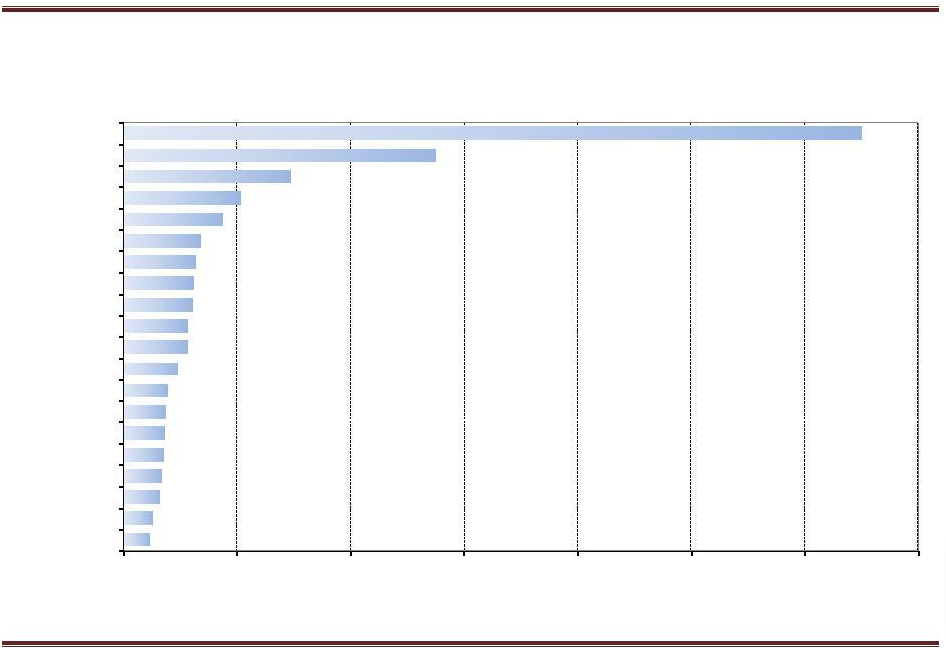
Refined Copper Production by Country: Top 20 Countries in 2013
Thousand metric tonnes Source: ICSG
China Chile
Japan United States Russian Fed.
Germany
Congo
India Korean Rep. Zambia Poland
Australia
Belgium
Mexico
Peru
Spain Kazakhstan
Canada
Brazil Bulgaria
0 | 1,000 | 2,000 | 3,000 | 4,000 | 5,000 | 6,000 | 7,000 |
The World Copper Factbook 2014
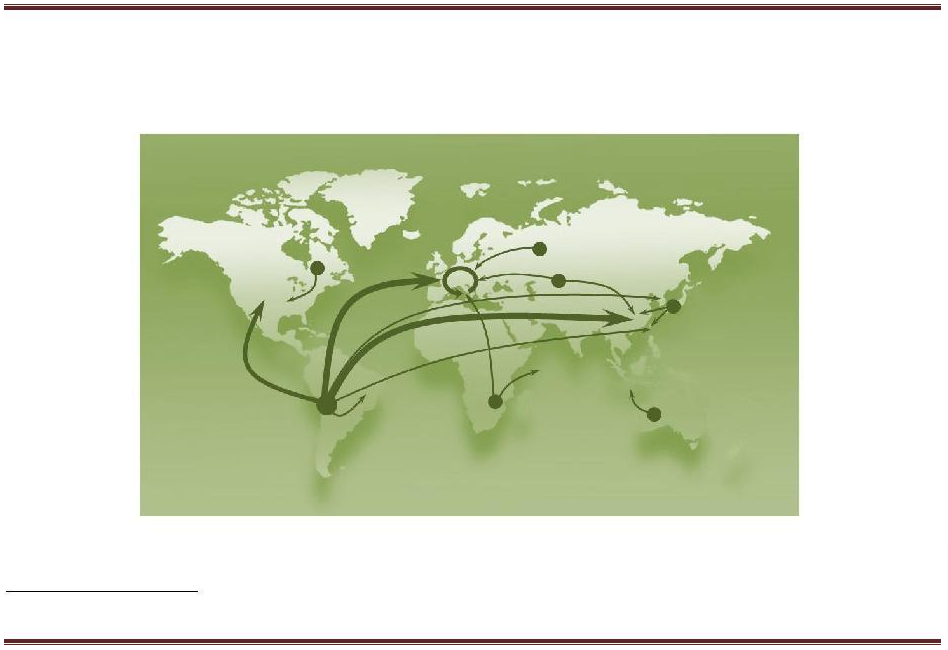
Major International Trade Flows of Refined Copper1
Major Exporters of | Major Importers of | ||
Refined Copper, | Refined Copper, | ||
2013 | 2013 | ||
1. | Chile | 1. | China |
2. | Japan | 2. | United States |
3. | Australia | 3. | Germany |
4. | Kazakhstan | 4. | Italy |
5. | Poland | 5. | Malaysia |
6. | China | 6. | Taiwan |
7. | Peru | 7. | Turkey |
8. | Malaysia | 8. | Korean Rep. |
9. | India | 9. | Thailand |
10. | Belgium | 10. | Brazil |
1Figure is intended to illustrate trade flows but not actual trade routes. Detailed trade matrices are available in ICSG Statistical Yearbook.
The World Copper Factbook 2014
24,000
22,000
20,000
18,000
16,000
14,000
12,000
10,000
8,000
6,000
4,000
2,000
0
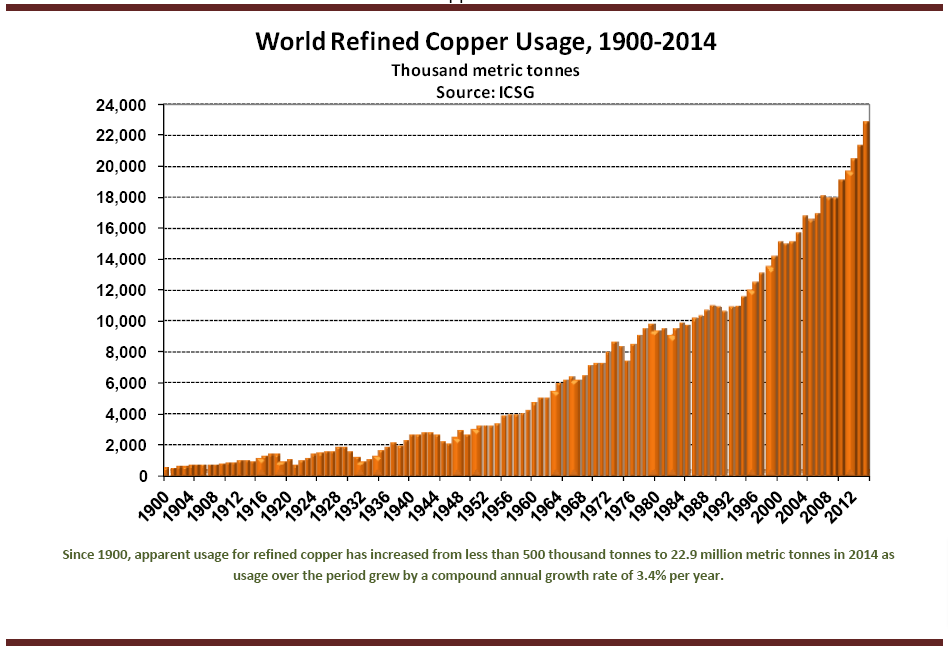
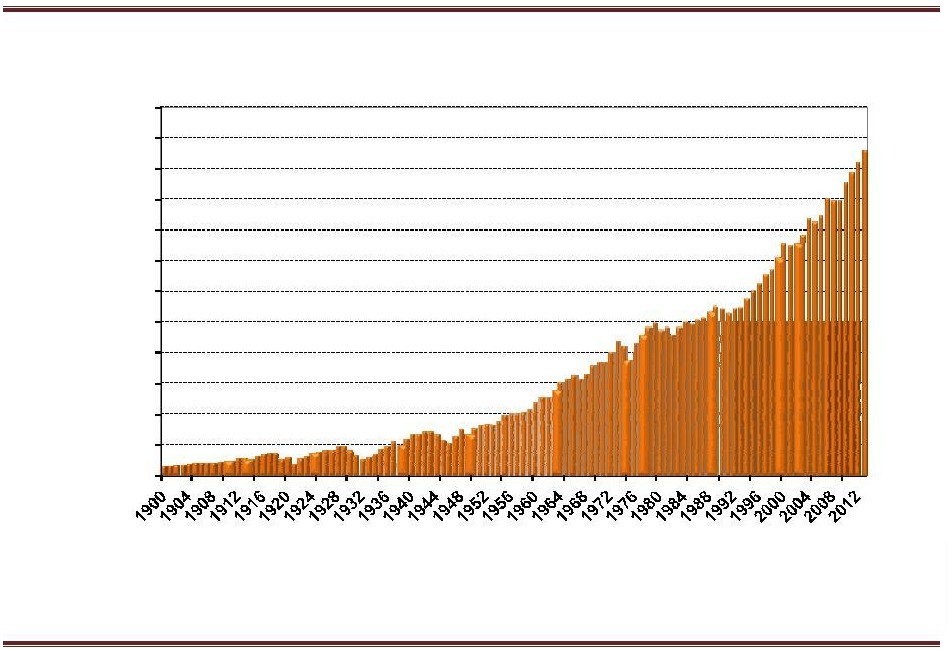
World Refined Copper Usage, 1900-2013
Thousand metric tonnes
Source: ICSG
Since 1900, apparent usage for refined copper has increased from less than 500 thousand tonnes to 21.2 million metric tonnes in 2013 as usage over the period grew by a compound annual growth rate of 3.4% per year.
The World Copper Factbook 2014
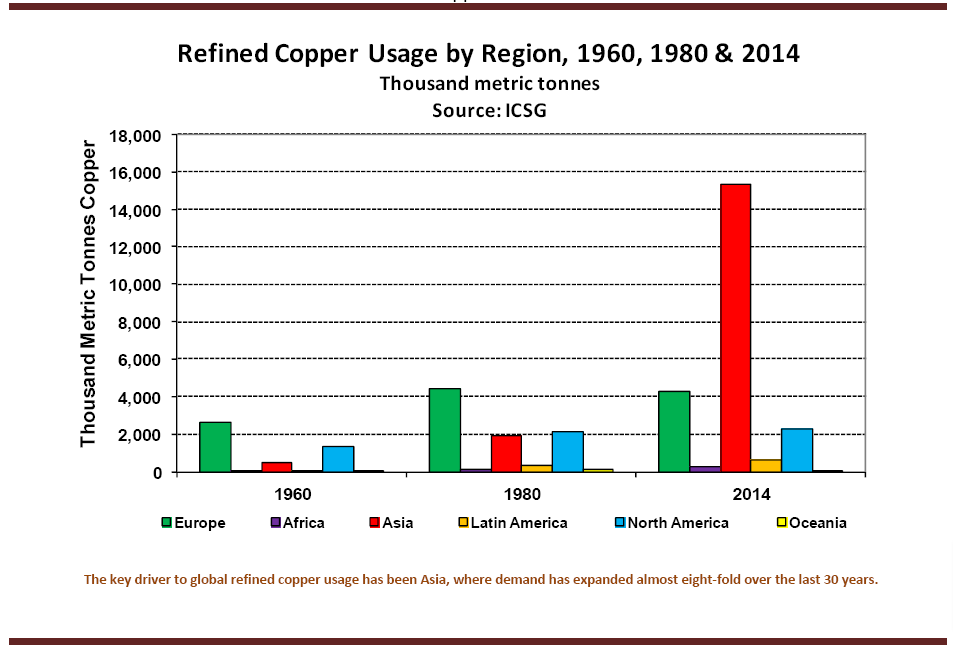
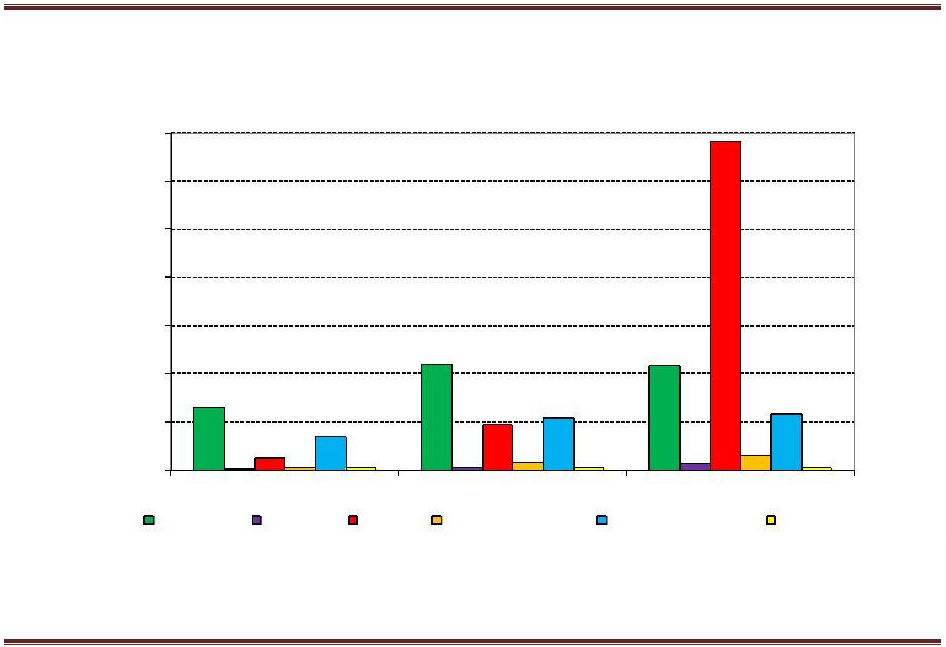
Refined Copper Usage by Region, 1960, 1980 & 2013
Thousand metric tonnes
Source: ICSG
14,000 | |||
Copper | 12,000 | ||
10,000 | |||
Tonnes | |||
8,000 | |||
Metric | 6,000 | ||
4,000 | |||
Thousand | |||
2,000 | |||
0 | |||
1960 | 1980 | 2013 |
Europe | Africa | Asia | Latin America | North America | Oceania |
The key driver to global refined copper usage has been Asia, where demand has expanded more than fivefold over the last 30 years.
The World Copper Factbook 2014
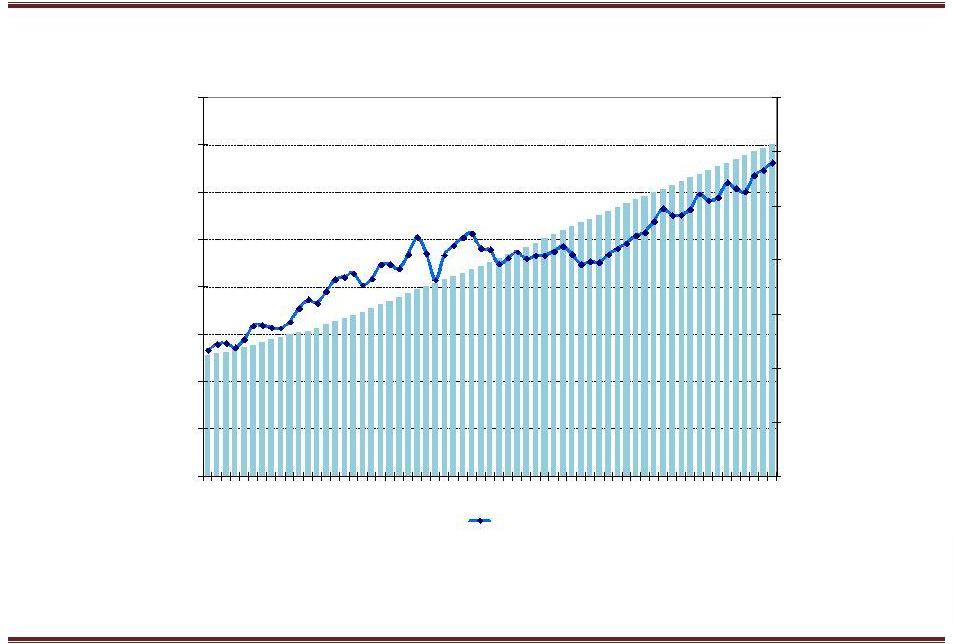
World Refined Copper Usage* per Capita: 1950-2013
Sources: ICSG and US Census Bureau
8 | 3.5 | |||||||||||||
7 | 3.0 | |||||||||||||
6 | 2.5 | |||||||||||||
Population (bln) | 5 | 2.0 | person per kg | |||||||||||
4 | ||||||||||||||
3 | 1.5 | |||||||||||||
2 | 1.0 | |||||||||||||
1 | 0.5 | |||||||||||||
0 | 0.0 | |||||||||||||
1950 | 1955 | 1960 | 1965 | 1970 | 1975 | 1980 | 1985 | 1990 | 1995 | 2000 | 2005 | 2010 |
World Population | Refined Copper Usage per Capita | |
*Refined copper is typically consumed by semis fabricators or the “first users” of refined copper, including ingot makers, master alloy plants, wire rod plants, brass mills, alloy wire mills, foundries and foil mills. As a result, per capita consumption of refined copper refers to the amount of copper consumed by industry divided by the total population and does not represent consumption of copper in finished products per person.

The World Copper Factbook 2013
Refined Copper Production
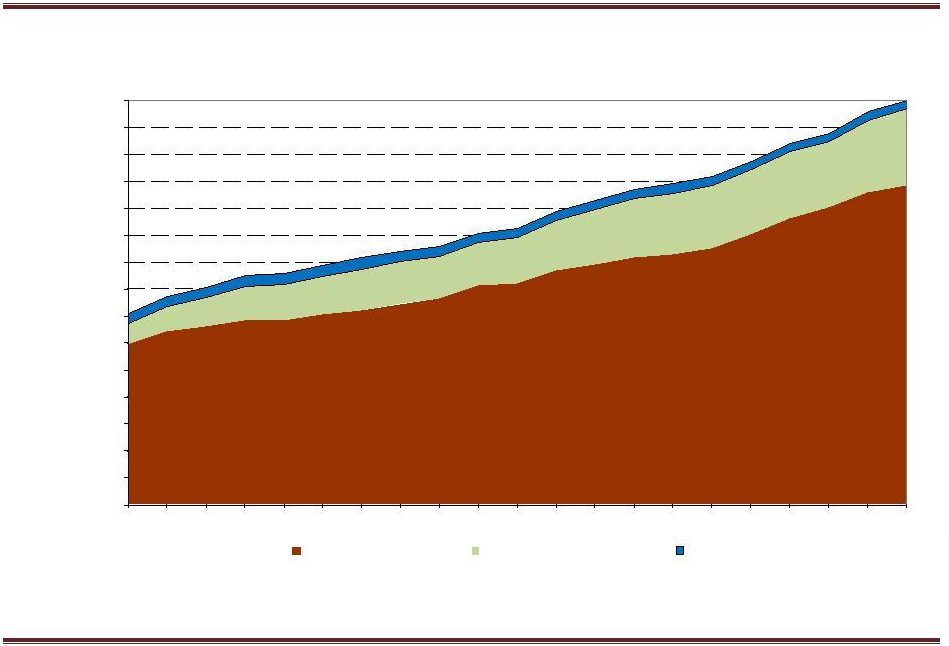
World Refined Copper Production, 1960-2012
Thousand metric tonnes
Source: ICSG
20,000 | |||||||||||||
17,500 | |||||||||||||
15,000 | |||||||||||||
12,500 | |||||||||||||
10,000 | |||||||||||||
7,500 | |||||||||||||
5,000 | |||||||||||||
2,500 | |||||||||||||
0 | |||||||||||||
1960 | 1964 | 1968 | 1972 | 1976 | 1980 | 1984 | 1988 | 1992 | 1996 | 2000 | 2004 | 2008 | 2012 |
Refinery Primary | Refinery Secondary | Refinery SX-EW | ||
With the emergence of solvent extraction-electrowinning (SX-EW) technology, refined copper produced from leaching ores has been on the rise, increasing from less than 1% of world refined copper production in the late 1960’s to 18% of world output in 2012.
The World Copper Factbook 2013
Trends in Refined Capacity, 1996-2016
Thousand metric tonnes copper
Source: ICSG Directory of Copper Mines and Plants - February 2013
30,000 | ||||||||||
28,000 | ||||||||||
26,000 | ||||||||||
24,000 | ||||||||||
22,000 | ||||||||||
20,000 | ||||||||||
18,000 | ||||||||||
16,000 | ||||||||||
14,000 | ||||||||||
12,000 | ||||||||||
10,000 | ||||||||||
8,000 | ||||||||||
6,000 | ||||||||||
4,000 | ||||||||||
2,000 | ||||||||||
- | ||||||||||
1996 | 1998 | 2000 | 2002 | 2004 | 2006 | 2008 | 2010 | 2012 | 2014 | 2016 |
Electrolytic | Electrowinning | Fire Refining | ||||||||
This chart shows world copper refinery capacity by refining process. The ratio between production and capacity is called the capacity utilization rate. The world refinery capacity utilization rate was around 79% in 2012.
The World Copper Factbook 2013
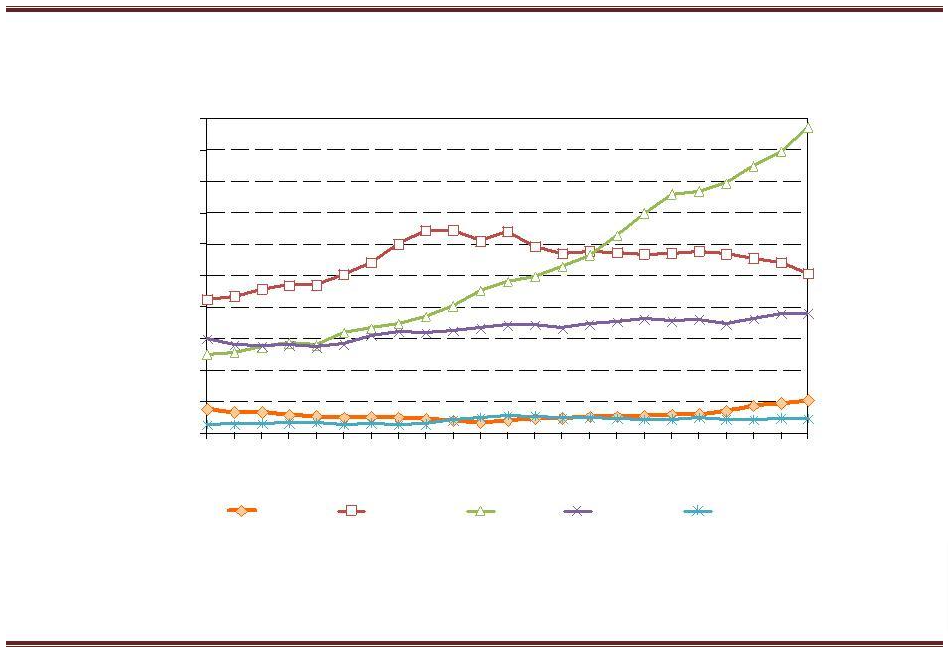
Refined Copper Production by Region, 1990-2012
Thousand metric tonnes
Source: ICSG
10,000 | ||||||||||||||||||||||
9,000 | ||||||||||||||||||||||
8,000 | ||||||||||||||||||||||
7,000 | ||||||||||||||||||||||
6,000 | ||||||||||||||||||||||
5,000 | ||||||||||||||||||||||
4,000 | ||||||||||||||||||||||
3,000 | ||||||||||||||||||||||
2,000 | ||||||||||||||||||||||
1,000 | ||||||||||||||||||||||
0 | ||||||||||||||||||||||
1990 | 1991 | 1992 | 1993 | 1994 | 1995 | 1996 | 1997 | 1998 | 1999 | 2000 | 2001 | 2002 | 2003 | 2004 | 2005 | 2006 | 2007 | 2008 | 2009 | 2010 | 2011 | 2012 |
Africa | America | Asia | Europe | Oceania |
Region with the highest output of refined copper in 1990: the Americas (4,250 kt), followed by Europe (3,000 kt)
Leading region in the world in 2012: Asia (9,720 kt) as compared to 2,500kt in 1990.

The World Copper Factbook 2013
Refined Copper Production by Country: Top 20 Countries in 2012
Thousand metric tonnes Source: ICSG
China
Chile
Japan United States Russian Fed.
India Germany Korean Rep. Poland Zambia Australia Congo Spain Belgium Mexico Kazakhstan Peru Canada Bulgaria Iran
0 | 1,000 | 2,000 | 3,000 | 4,000 | 5,000 | 6,000 |
The World Copper Factbook 2013
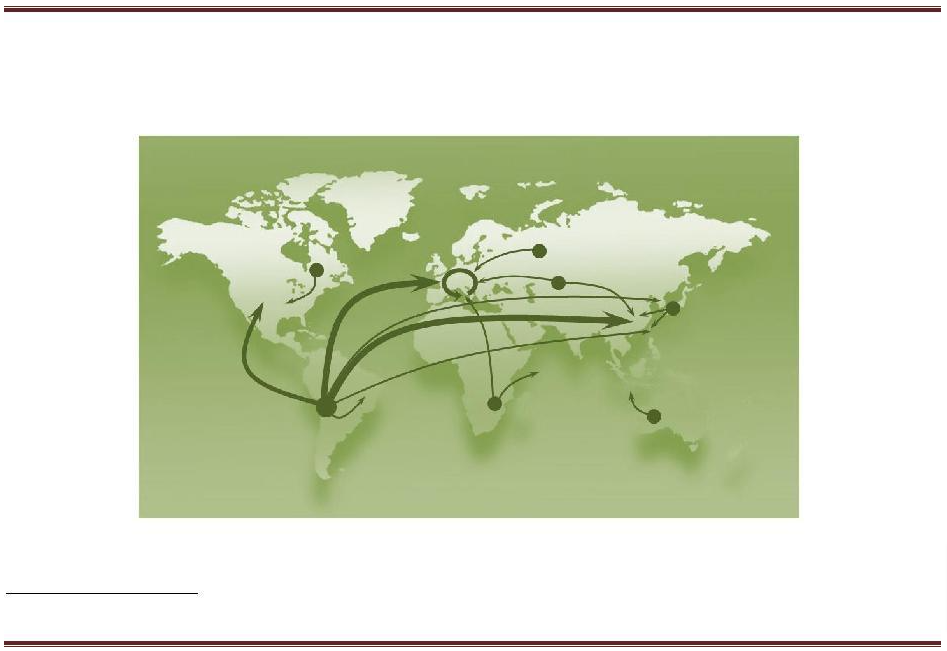
Major International Trade Flows of Refined Copper1
Major Exporters of | Major Importers of | ||
Refined Copper, | Refined Copper, | ||
2012 | 2012 | ||
1. | Chile | 1. | China |
2. | Japan | 2. | Germany |
3. | Australia | 3. | United States |
4. | Kazakhstan | 4. | Italy |
5. | Poland | 5. | Taiwan |
6. | Germany | 6. | Turkey |
7. | China | 7. | Korean Rep. |
8. | Zambia | 8. | Brazil |
9. | India | 9. | Thailand |
10. | Peru | 10. | France |
1Figure is intended to illustrate trade flows but not actual trade routes. Detailed trade matrices are available in ICSG Statistical Yearbook.
The World Copper Factbook 2013
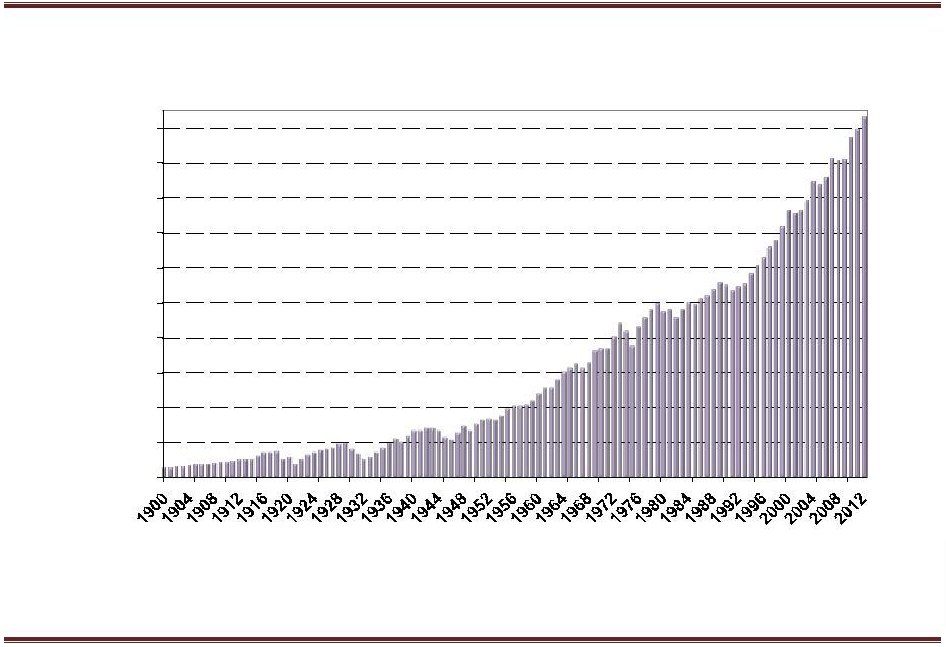
World Refined Copper Usage, 1900-2012
Thousand metric tonnes Source: ICSG
20,000
18,000
16,000
14,000
12,000
10,000
8,000
6,000
4,000
2,000
0
Since 1900, demand for refined copper increased from less than 500 thousand tonnes to over 20 million metric tonnes in 2012 as demand over the period grew by a compound annual growth rate of 3.4% per year.

The World Copper Factbook 2013
Refined Copper Usage by Region, 1960, 1980 & 2012
Thousand metric tonnes Source: ICSG
Thousand Metric Tonnes Copper
Europe | Africa | Asia | Latin America | North America | Oceania | |
14,000
12,000
10,000
8,000
6,000
4,000
2,000
0
1960 | 1980 | 2012 |
Growth in refined copper usage has been especially strong in Asia, where demand has expanded more than fivefold over the last 30 years.
The World Copper Factbook 2013
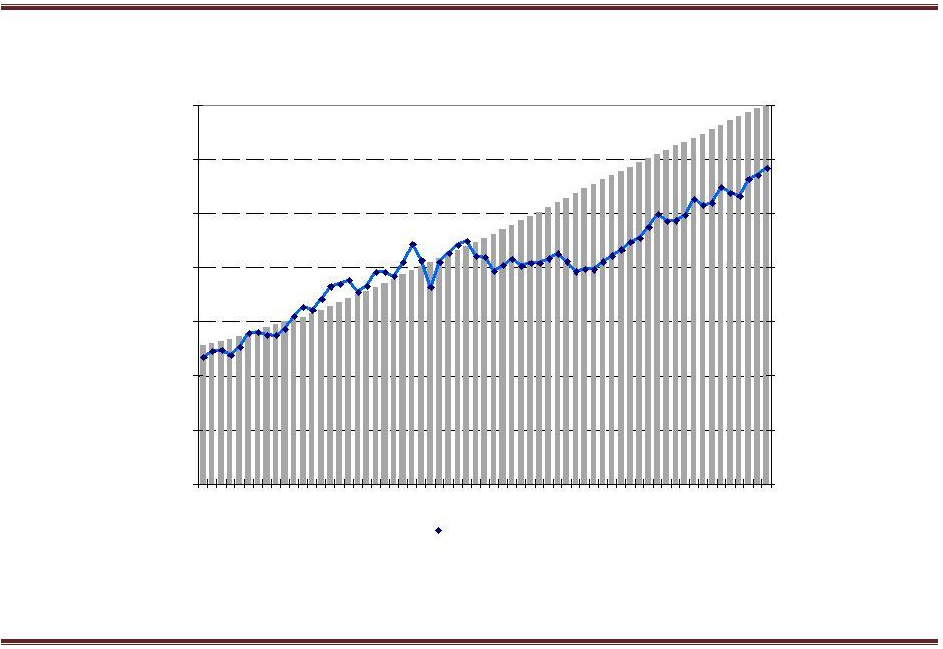
World Refined Copper Usage* per Capita: 1950-2012
Sources: ICSG and US Census Bureau
7 | 3.5 | ||||||||||||
6 | 3.0 | ||||||||||||
5 | 2.5 | ||||||||||||
Population (bln) | 4 | 2.0 | |||||||||||
3 | 1.5 | ||||||||||||
kgpersonper | |||||||||||||
2 | 1.0 | ||||||||||||
1 | 0.5 | ||||||||||||
0 | 0.0 | ||||||||||||
1950 | 1955 | 1960 | 1965 | 1970 | 1975 | 1980 | 1985 | 1990 | 1995 | 2000 | 2005 | 2010 |
World Population | Refined Copper Usage per Capita | ||
*Refined copper is typically consumed by semis fabricators or the “first users” of refined copper, including ingot makers, master alloy plants, wire rod plants, brass mills, alloy wire mills, foundries and foil mills. As a result, per capita consumption of refined copper refers to the amount of copper consumed by industry divided by the total population and does not represent consumption of copper in finished products per person.
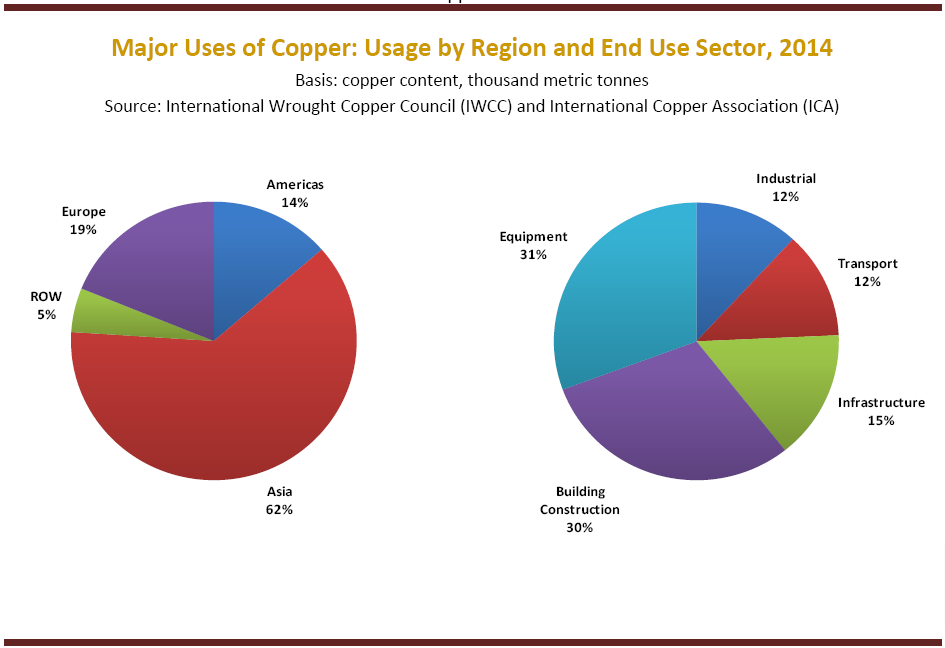

The World Copper Factbook 2014
Major Uses of Copper: Usage by Region and End Use Sector, 2013
Basis: copper content, thousand metric tonnes
Source: International Wrought Copper Council (IWCC) and International Copper Association (ICA)
Americas
14%
Europe
19% Equipment
31%
ROW 5%
Asia | Building |
62% | Construction |
30% |
Industrial
12%
Transport
12%
Infrastructure
15%

The World Copper Factbook 2013
Major Uses of Copper: Usage by Region and End Use Sector, 2012
Basis: copper content, thousand metric tonnes
Source: International Wrought Copper Council (IWCC) and International Copper Association (ICA)
Americas | Industrial | ||
12% | |||
Europe | 14% | ||
20% | Equipment | ||
30% | Transport | ||
13% | |||
ROW | |||
6% | |||
Infrastructure | |||
15% | |||
Asia | Building | ||
Construction | |||
60% | |||
30% | |||
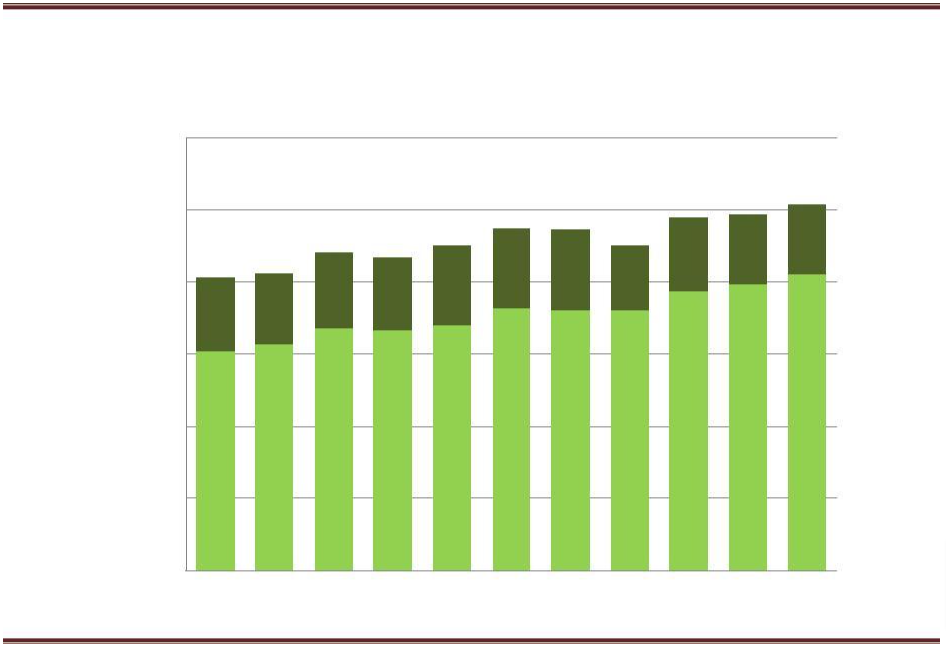
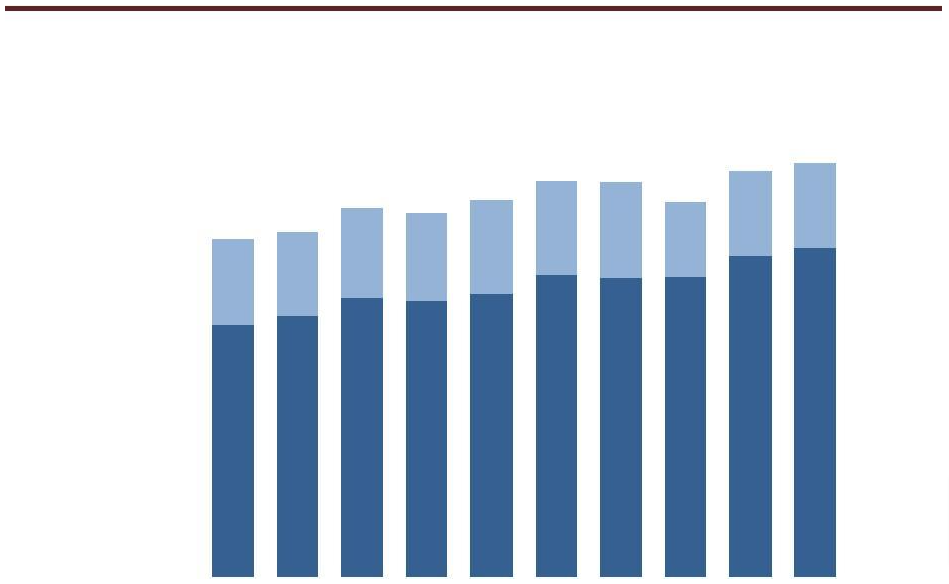
Total Copper Usage, Including Direct Melted Copper Scrap, 2002-2012
Source: ICSG Recyclables Survey March 2014
25,000
2004 | 2008 | 2012 |
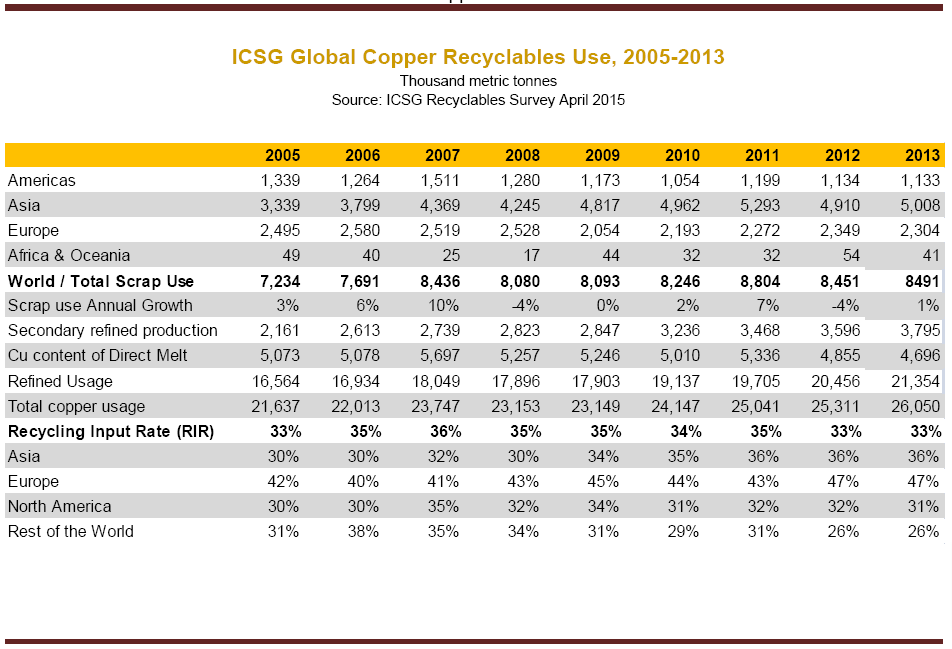
ICSG Global Copper Recyclables Use, 2004-2012
Source: ICSG Recyclables Survey March 2014
2004 | 2006 | 2008 | 2010 | 2012 |
1,324 | 1,395 | 1,275 | 1,198 | 1,213 |
3,279 | 4,132 | 4,706 | 4,913 | 4,993 |
2,624 | 2,585 | 2,424 | 2,226 | 2,177 |
37 | 25 | 24 | 24 | 56 |
7,269 | 8,141 | 8,437 | 8,365 | 8445 |
9% | 12% | 2% | 15% | 1% |
2,069 | 2,613 | 2,823 | 3,250 | 3,580 |
5,199 | 5,528 | 5,614 | 5,116 | 4,865 |
16,838 | 17,034 | 18,053 | 19,346 | 20,550 |
22,037 | 22,563 | 23,667 | 24,462 | 25,415 |
33% | 36% | 36% | 34% | 33% |
31% | 37% | 36% | 33% | 31% |
42% | 41% | 42% | 45% | 45% |
29% | 32% | 32% | 33% | 33% |
13% | 15% | 16% | 12% | 14% |
The World Copper Factbook 2013
Total Copper Usage, Including Copper Scrap, 2002-2011
Thousand metric tonnes copper
Source: ICSG
25,000 | Direct melt scrap | Refined usage | ||||||||||||||
20,000 | ||||||||||||||||
15,000 | ||||||||||||||||
10,000 | ||||||||||||||||
5,000 | ||||||||||||||||
0 | ||||||||||||||||
2002 | 2003 | 2004 | 2005 | 2006 | 2007 | 2008 | 2009 | 2010 | 2011 | |||||||
The World Copper Factbook 2013
ICSG Global Copper Recyclables Use, 2003-2011
Thousand metric tonnes
Source: ICSG
2003 | 2004 | 2005 | 2006 | 2007 | 2008 | 2009 | 2010 | 2011 | |
Americas | 1,377 | 1,426 | 1,425 | 1,498 | 1,540 | 1,367 | 1,225 | 1,197 | 1,242 |
Asia | 2,905 | 3,372 | 3,564 | 4,219 | 4,314 | 4,768 | 4,246 | 4,998 | 5,260 |
Europe | 2,519 | 2,624 | 2,440 | 2,585 | 2,556 | 2,445 | 1,936 | 2,217 | 2,102 |
Africa & Oceania | 42 | 37 | 37 | 25 | 29 | 24 | 23 | 24 | 33 |
World / Total Scrap Use | 6,848 | 7,464 | 7,475 | 8,332 | 8,448 | 8,611 | 7,435 | 8,442 | 8,643 |
Scrap use Annual Growth | -2.7% | 9.0% | 0.1% | 11.5% | 1.4% | 1.9% | -13.7% | 13.5% | 2.4% |
Secondary refined production | 1,786 | 2,069 | 2,161 | 2,613 | 2,738 | 2,823 | 2,841 | 3,250 | 3,470 |
Cu content of Direct Melt | 5,062 | 5,394 | 5,314 | 5,719 | 5,710 | 5,788 | 4,594 | 5,192 | 5,173 |
Refined Usage | 15,717 | 16,838 | 16,674 | 17,034 | 18,196 | 18,053 | 18,070 | 19,346 | 19,830 |
Total copper usage | 20,779 | 22,232 | 21,988 | 22,753 | 23,906 | 23,841 | 22,664 | 24,538 | 25,003 |
Recycling Input Rate (RIR) | 33% | 34% | 34% | 37% | 35% | 36% | 33% | 34% | 35% |
Asia | 30% | 32% | 33% | 37% | 34% | 36% | 30% | 33% | 34% |
Europe | 41% | 42% | 41% | 41% | 41% | 42% | 44% | 45% | 41% |
North America | 32% | 30% | 31% | 34% | 35% | 33% | 36% | 33% | 34% |
Rest of the World | 13% | 13% | 15% | 15% | 18% | 16% | 14% | 12% | 14% |
End Uses of Lead
The principal consumption of lead is for lead-acid batteries which are used in vehicles, and in emergency systems (e.g. hospitals) as well as in industrial batteries found in computers and fork lift trucks. Lead is also used in remote access power systems and load levelling systems as well as in compounds in the glass and plastics industries and for radiation shielding. Average end use patterns over the last five years are illustrated in chart 1.
Chart 1:End Uses of Lead
End Uses of Zinc
Zinc's effectiveness in protecting steel against corrosion by galvanising is well recognised, while the ability to die cast complicated components makes zinc indispensable in a multitude of industry and household products. It also has important markets in the brass and construction industries and in chemicals and constitutes an essential nutritional element. Zinc's main end uses are shown in chart 2.
Chart 2:End Uses of Zinc

support@mtlexs.com
10am-7pm
Copyright © 2023. All rights reserved. | Powered by Beacon Minds™